Data Visualization Courses
Data visualization courses can help you learn how to create compelling charts, graphs, and dashboards, along with understanding data storytelling and visual design principles. You can build skills in interpreting data trends, selecting appropriate visual formats, and conveying insights effectively to diverse audiences. Many courses introduce tools like Tableau, Power BI, and D3.js, that support transforming raw data into visual narratives and making data-driven decisions in various fields.
Popular Data Visualization Courses and Certifications

Skills you'll gain: Prompt Engineering, Generative AI, LLM Application, Large Language Modeling, Model Deployment, Unstructured Data, Application Development, Transfer Learning, Natural Language Processing
Skills you'll gain: Data Validation, Microsoft Excel, Spreadsheet Software, Data Entry, Data Integrity, Microsoft Office
Google Cloud
Skills you'll gain: Google Workspace, File Management, Document Management, Collaborative Software, Cloud Storage, Data Sharing, Shared Media, Content Management, Identity and Access Management

Universiteit Leiden
Skills you'll gain: Health Disparities, Health Systems, Health Promotion, Value-Based Care, Public Health, Health Care, Health Policy, Social Determinants Of Health, Community Health, Preventative Care, Epidemiology, Risk Analysis

Johns Hopkins University
Skills you'll gain: Software Documentation, Leaflet (Software), Data Preprocessing, Technical Documentation, Data Cleansing, Data Visualization Software, Code Review, R Programming, GitHub, Continuous Integration, Software Testing
National Taiwan University
Skills you'll gain: SketchUp (3D Modeling Software), 3D Modeling, Architectural Drawing, Computer-Aided Design, Construction, Visualization (Computer Graphics), Building Design, Architectural Design
Skills you'll gain: Databricks, Data Lakes, Data Pipelines, Data Integration, Dashboard, PySpark, SQL, Apache Spark, Data Management, Data Transformation, Version Control

Skills you'll gain: User Research, Internet Of Things, Usability Testing, Prototyping, Design Thinking, Ideation, Automation, Advanced Analytics, User Experience Design, Big Data, User Centered Design, IT Security Architecture, Interaction Design, Data-Driven Decision-Making, Human Centered Design, Data Management, Robotics, Control Systems, Hardware Architecture, Manufacturing Processes

Illinois Tech
Skills you'll gain: Database Systems, Relational Databases, Database Management, Database Theory, Databases, SQL, Database Design, Database Management Systems, Database Architecture and Administration, Data Access, Query Languages, Data Modeling, Data Manipulation, User Accounts

Illinois Tech
Skills you'll gain: Relational Databases, Database Management, Database Development, SQL, MySQL, Database Design, Transaction Processing, Stored Procedure, Java, Data Structures, Data Integrity, Performance Tuning

Skills you'll gain: Time Series Analysis and Forecasting, Exploratory Data Analysis, Model Evaluation, Feature Engineering, Data Preprocessing, Statistical Analysis, Forecasting, Regression Analysis, Python Programming, Data Analysis, Predictive Modeling, Data Science, Matplotlib, Pandas (Python Package), Scikit Learn (Machine Learning Library), Machine Learning Algorithms

Google Cloud
Skills you'll gain: Google Sheets, Spreadsheet Software, Excel Formulas, Google Docs, Data Visualization, Data Validation, Business Analysis, Data Analysis Software, Data Integration, Automation, Data Import/Export
In summary, here are 10 of our most popular data visualization courses
- Introduction to Generative AI with Snowflake: Snowflake
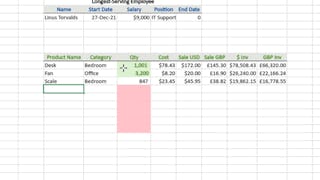
- Excel for Beginners: Sorting, Filtering, Data-Validation: Coursera
- Google Drive en Español: Google Cloud
- Population Health: Fundamentals of Population Health Management: Universiteit Leiden
- Mastering Software Development in R Capstone: Johns Hopkins University
- 工程圖學 3D CAD 專題: National Taiwan University
- Data Management with Databricks: Big Data with Delta Lakes: Coursera
- IoT Systems and Industrial Applications with Design Thinking: LearnQuest
- Introduction to Relational Databases: Illinois Tech
- Relational Database Implementation and Applications: Illinois Tech


